Plots.jl with PyPlot backend and LaTeX rendering
Addendum, January 10, 2023
Two things have happened since I wrote this post: 1) Plots.pyrcparams no longer exists in the current version of Plots.jl, and 2) it is recommended to switch from the PyPlot backend to PythonPlot. I’ve modified the code below to address the first problem so that it will still work as it did originally with PyPlot.jl. If you want to switch to PythonPlot, all you need to do below is replace pyplot() with pythonplot() and PyPlot with PythonPlot.
Original post (with updated code)
The Julia Plots.jl package has multiple backends with different uses. To create professional plots for inclusion in LaTeX documents, it is helpful to be able to render all text with LaTeX. This really helps for seemless integration.
I’ve found that there are two main options:
The first option is to use the PGFPlotsX backend. One of the possible exports with PGFPlotsX is code that can be included directly in a LaTeX document. This can be a great choice because when you make changes to and recompile your document, the plot is also recompiled bringing with it any changes in font properties. I don’t do it this way because keeping your plots around only as code is an extra layer of friction if you’re working with collaborators.
The second option is the PyPlot backend. By setting the proper options, you can generate text via LaTeX and customize the preamble if desired. This is what I’ve ended up using most of the time.
There are two ways to get the PyPlot backend to use LaTeX. The first is to use a matplotlibrc file which includes text.usetex: True. To get the font you most likely expect, also include font.family: serif. You can add to the preamble, e.g., text.latex.preamble: \usepackage{mathtools,amssymb}.
Rather than use a matplotlibrc file, I prefer to modify the rc parameters directly in the code. My plotting set up usually looks like this, with extra options included in the final line where I call default(...):
| |
On line 3, I restore matplotlib defaults (overriding any user matplotlib file) so that the code gives a more reproducible result. On line 6, note that you have to escape the backslashes. On line 8, I set the default formatter to :latex (which comes from a PR I contributed to Plots.jl) which replaces the unicode × with the LaTeX \times when scientific notation is needed for tick labels.
Now we can simply plot as usual.
| |
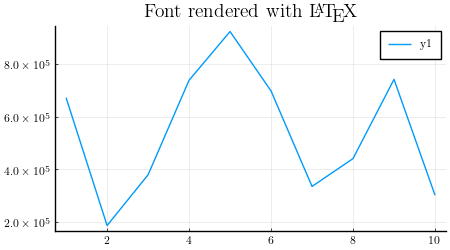
I’ve used a png here just because this is the web. For inclusion in a LaTeX document (or any high quality document), export your plots to pdf.